BTCIllustrated.com
Bitcoin Blockchain Visualizations
Source Code and Dataset
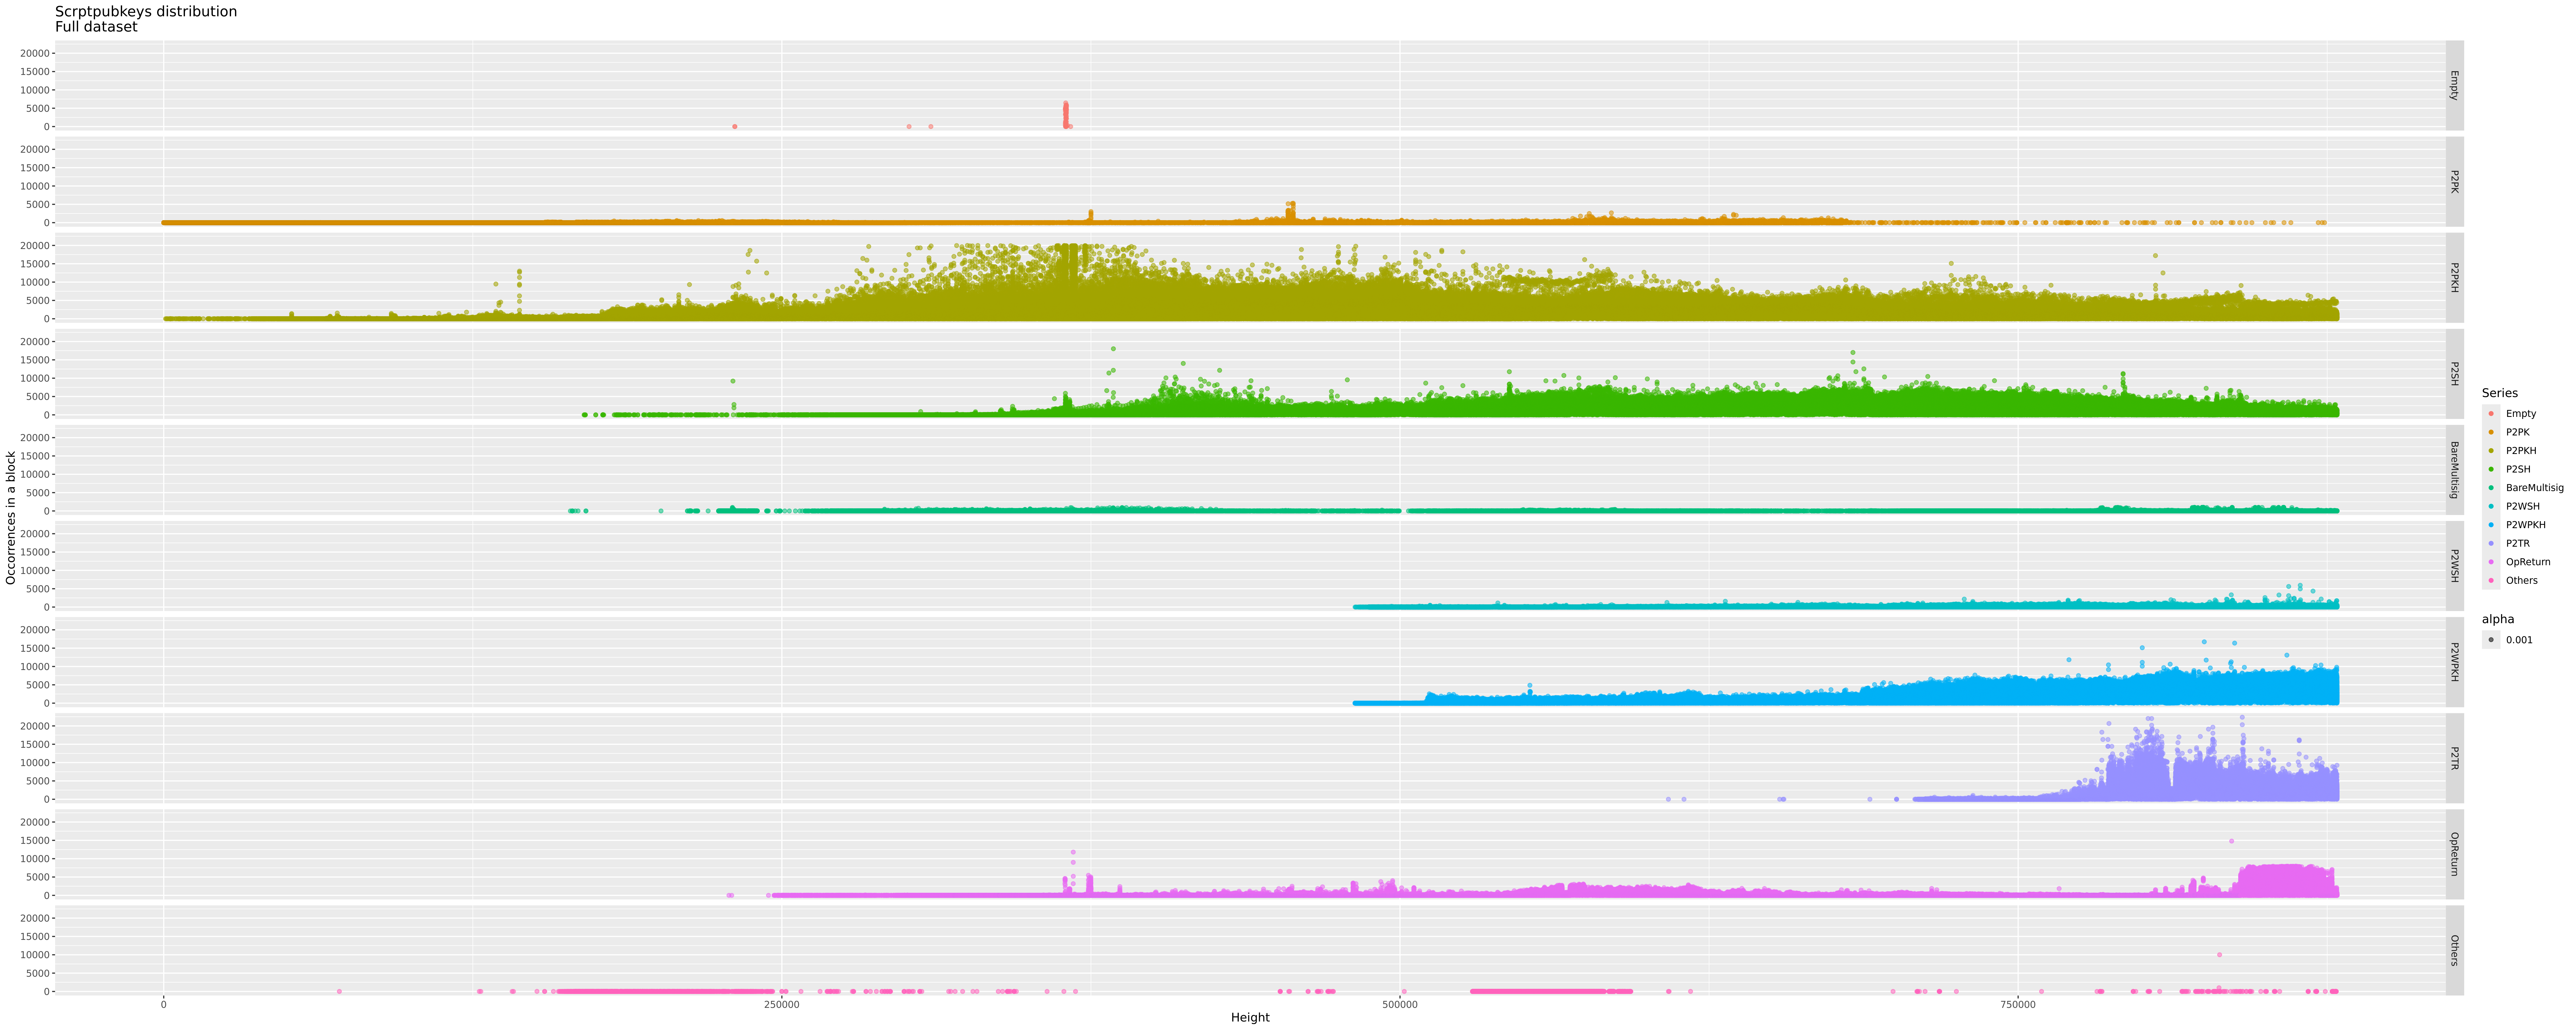
Charts are generated in R using scripts available in the GitHub repo r-scripts.
Information are extracted from the Bitcoin blockchain using:
- blocks_iterator (tnx Riccardo!)
- scriptpubkeys_per_block
You can download the Dataset used for these charts and update daily.
Price from blockchain data dataset is realized by Riccardo Casatta - https://twitter.com/RCasatta (tnx again!)
Last update on:


